12.5. Requirements for functions describing an “observer”
Some special variables, internal to the optimization process and used inside calculation, can be monitored during an ADAO calculation. These variables can be printed, plotted, saved, etc. by the user. This can be done using some “observer”, sometimes also called “callback”, on a variable. They are special Python functions, each one associated with a given variable, as conceptually described in the following figure:
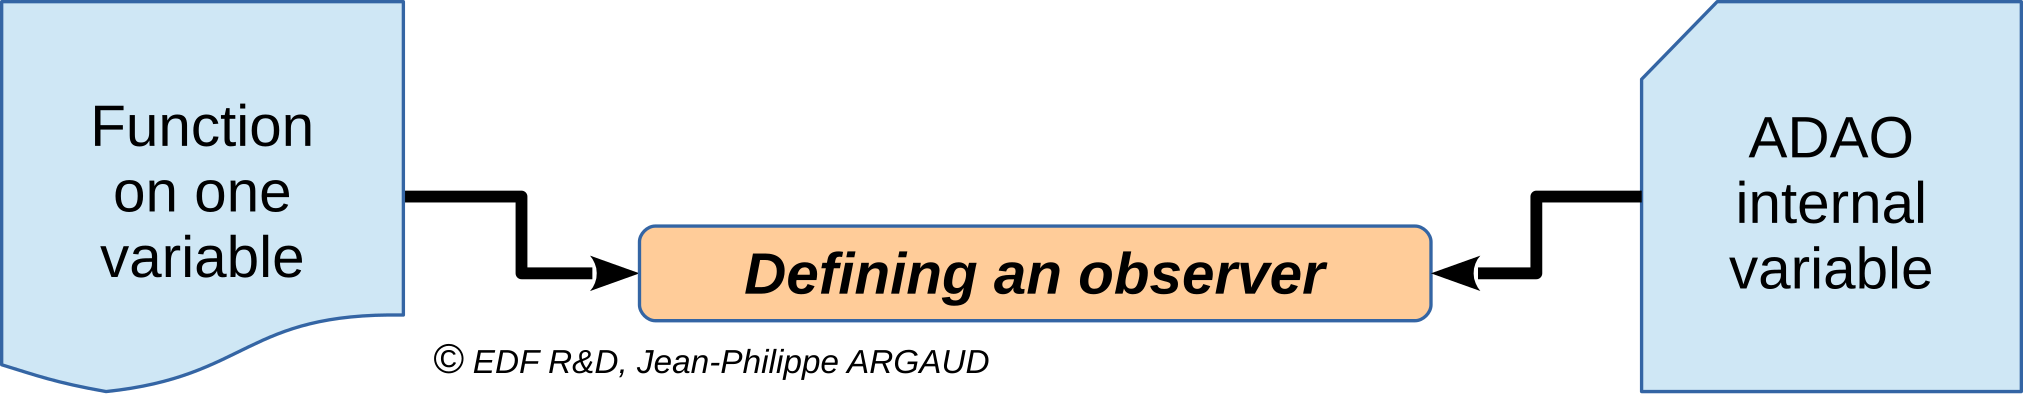
Conceptual definition of an “observer” function
These “observer” functions are described in the next subsections.
12.5.1. Register and activate of an “observer” function
In the graphical interface EFICAS of ADAO, there are 3 practical methods to provide an “observer” function in an ADAO case. The method is chosen with the “NodeType” keyword of each “observer” entry type, as shown in the following figure:
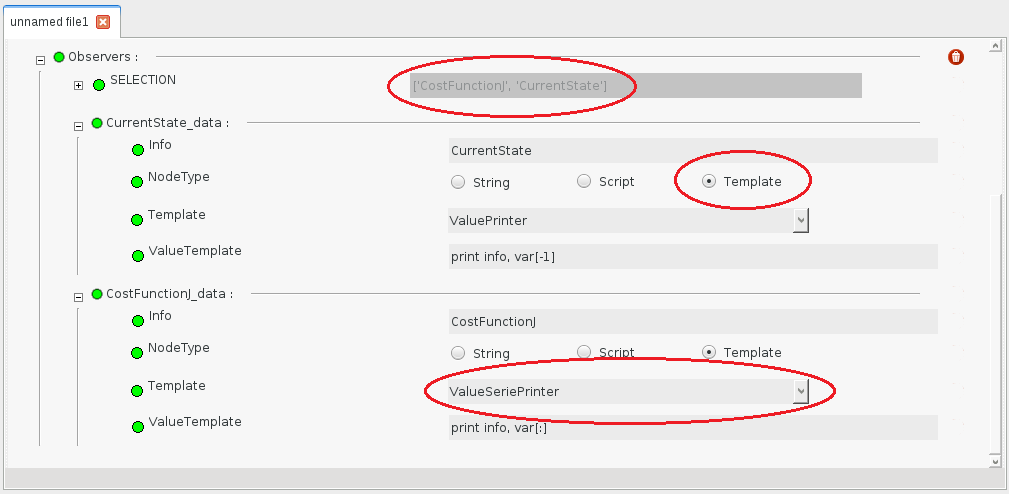
Choosing its entry type for an “observer” function
An “observer” function can be given as an explicit script (entry of type “String”), as a script in an external file (entry of type “Script”), or by using a template or pattern (entry of type”Template”). The templates are available by default in ADAO, using the graphical interface EFICAS or the text interface TUI, and are detailed in the following Inventory of available “observer” function models (“Template”). These templates are simple scripts that can be tuned by the user, either in the integrated edition stage of the case with ADAO EFICAS, or in the edition stage of the schema before execution, to improve the ADAO case performance in the SALOME execution supervisor YACS.
In the textual interface (TUI) of ADAO (see the part [DocR] Textual User Interface for ADAO (TUI/API)), the same information can be given with the command “setObserver” applied to a specific variable indicated using the “Variable” argument. The other arguments of this command allow to define an “observer” either as a template (“Template” argument) representing one of the scripts detailed in the part Inventory of available “observer” function models (“Template”), or as an explicit script (“String” argument), or as a script in an external file (“Script” argument).
12.5.2. General form for a script describing an “observer” function
An “observer” function is a special Python script, associated with a given variable, and that is automatically activated for each variable modification during calculation. Every (carefully established) function that applies to the selected variable can be used. Many “observer” functions are available by default.
To use directly this “observer” capability, the user must use or build a
script that have on standard input (that is, in the naming space) the variables
var and info. The variable var is to be used as an object of
list/tuple type, that contains the history of the variable of interest, indexed
by the iterating and/or time steps. Only the body of the “observer” function
has to be specified by the user, not the Python def function call itself.
As an example, here is a very simple script (similar to the “ValuePrinter” template), that can be used to print the value of the monitored variable:
print(" --->",info," Value =",var[-1])
Stored as a Python file or as an explicit string, this or these script lines can be associated to each variable found in the keyword “SELECTION” of the “Observers” command of the ADAO case: “Analysis”, “CurrentState”, “CostFunction”… The current value of the variable will for example be printed at each step of the optimization or data assimilation algorithm. The “observer” can include graphical output, storage capacities, complex treatment, statistical analysis, etc. If the variable, to which the “observer” is linked, is not required in the calculation and by the user, the execution of this “observer” is simply never activated.
Warning
If not using the default available templates, it is up to the user to make carefully established function scripts or external programs that do not crash before being registered as an “observer” function. The debugging can otherwise be really difficult!
Some “observer” allow the creation of successive files or figures, which are
uniquely numbered and, if applicable, stored by default in a standard temporary
directory as /tmp or obtained by the Python module tempfile. In the
case where this information needs to be modified (as for example when the
temporary directory is a virtual or local non-permanent folder, or when one
wishes to have a numbering according to the iteration like in some examples),
the user is encouraged to take inspiration from a model that is suitable for
him and to modify it by specifying differently this shared information. Then,
the modified function can be used in a “String” or “Script” input.
Note
Some of the “observers” allow to create figures using the built-in Python module Gnuplot.py [Gnuplot.py], here updated to support Python 3. This module is an interface to control and to send arguments to the outstanding classic utility for graphic plotting Gnuplot [Gnuplot]. Available for most environments, Gnuplot is independent and must be correctly preinstalled.
Hereinafter we give the identifier and the contents of all the available “observer” models.
12.5.3. Inventory of available “observer” function models (“Template”)
12.5.3.1. Template ValuePrinter
Print on standard output the current value of the variable.
print(str(info)+" "+str(var[-1]))
12.5.3.2. Template ValueAndIndexPrinter
Print on standard output the current value of the variable, adding its index.
print(str(info)+(" index %i:"%(len(var)-1))+" "+str(var[-1]))
12.5.3.3. Template ValueSeriePrinter
Print on standard output the value series of the variable.
print(str(info)+" "+str(var[:]))
12.5.3.4. Template ValueSaver
Save the current value of the variable in a file available in the system temporary directory named ‘value…txt’ from the variable name and the saving step.
import os.path, numpy, re, tempfile
tempdir=tempfile.gettempdir()
v=numpy.array(var[-1], ndmin=1)
global istep
try:
    istep+=1
except:
    istep=0
f=os.path.join(tempdir,'value_%s_%05i.txt'%(info,istep))
f=re.sub(r'\s','_',f)
print('Value saved in "%s"'%f)
numpy.savetxt(f,v)
12.5.3.5. Template ValueSerieSaver
Save the value series of the variable in a file available in the system temporary directory named ‘value…txt’ from the variable name and the saving step.
import os.path, numpy, re, tempfile
tempdir=tempfile.gettempdir()
v=numpy.array(var[:], ndmin=1)
global istep
try:
    istep+=1
except:
    istep=0
f=os.path.join(tempdir,'value_%s_%05i.txt'%(info,istep))
f=re.sub(r'\s','_',f)
print('Value saved in "%s"'%f)
numpy.savetxt(f,v)
12.5.3.6. Template ValuePrinterAndSaver
Print on standard output and, in the same time save in a file available in the system temporary directory, the current value of the variable.
import os.path, numpy, re, tempfile
tempdir=tempfile.gettempdir()
v=numpy.array(var[-1], ndmin=1)
print(str(info)+" "+str(v))
global istep
try:
    istep+=1
except:
    istep=0
f=os.path.join(tempdir,'value_%s_%05i.txt'%(info,istep))
f=re.sub(r'\s','_',f)
print('Value saved in "%s"'%f)
numpy.savetxt(f,v)
12.5.3.7. Template ValueIndexPrinterAndSaver
Print on standard output and, in the same time save in a file available in the system temporary directory, the current value of the variable, adding its index.
import os.path, numpy, re, tempfile
tempdir=tempfile.gettempdir()
v=numpy.array(var[-1], ndmin=1)
print(str(info)+(" index %i:"%(len(var)-1))+" "+str(v))
global istep
try:
    istep+=1
except:
    istep=0
f=os.path.join(tempdir,'value_%s_%05i.txt'%(info,istep))
f=re.sub(r'\s','_',f)
print('Value saved in "%s"'%f)
numpy.savetxt(f,v)
12.5.3.8. Template ValueSeriePrinterAndSaver
Print on standard output and, in the same time, save in a file available in the system temporary directory, the value series of the variable.
import os.path, numpy, re, tempfile
tempdir=tempfile.gettempdir()
v=numpy.array(var[:], ndmin=1)
print(str(info)+" "+str(v))
global istep
try:
    istep+=1
except:
    istep=0
f=os.path.join(tempdir,'value_%s_%05i.txt'%(info,istep))
f=re.sub(r'\s','_',f)
print('Value saved in "%s"'%f)
numpy.savetxt(f,v)
12.5.3.9. Template ValueGnuPlotter
Graphically plot with Gnuplot the current value of the variable (persistent plot).
import numpy, Gnuplot
v=numpy.array(var[-1], ndmin=1)
global igfig, gp
try:
    igfig+=1
    gp('set title "%s (Figure %i)"'%(info,igfig))
except:
    igfig=0
    gp=Gnuplot.Gnuplot(persist=1)
    gp('set title "%s (Figure %i)"'%(info,igfig))
    gp('set style data lines')
gp.plot( Gnuplot.Data( v, with_='lines lw 2' ) )
12.5.3.10. Template ValueSerieGnuPlotter
Graphically plot with Gnuplot the value series of the variable (persistent plot).
import numpy, Gnuplot
v=numpy.array(var[:], ndmin=1)
global igfig, gp
try:
    igfig+=1
    gp('set title "%s (Figure %i)"'%(info,igfig))
except:
    igfig=0
    gp=Gnuplot.Gnuplot(persist=1)
    gp('set title "%s (Figure %i)"'%(info,igfig))
    gp('set style data lines')
    gp('set xlabel "Step"')
    gp('set ylabel "Variable"')
gp.plot( Gnuplot.Data( v, with_='lines lw 2' ) )
12.5.3.11. Template ValuePrinterAndGnuPlotter
Print on standard output and, in the same time, graphically plot with Gnuplot the current value of the variable (persistent plot).
print(str(info)+' '+str(var[-1]))
import numpy, Gnuplot
v=numpy.array(var[-1], ndmin=1)
global igfig, gp
try:
    igfig+=1
    gp('set title "%s (Figure %i)"'%(info,igfig))
except:
    igfig=0
    gp=Gnuplot.Gnuplot(persist=1)
    gp('set title "%s (Figure %i)"'%(info,igfig))
    gp('set style data lines')
gp.plot( Gnuplot.Data( v, with_='lines lw 2' ) )
12.5.3.12. Template ValueSeriePrinterAndGnuPlotter
Print on standard output and, in the same time, graphically plot with Gnuplot the value series of the variable (persistent plot).
print(str(info)+' '+str(var[:]))
import numpy, Gnuplot
v=numpy.array(var[:], ndmin=1)
global igfig, gp
try:
    igfig+=1
    gp('set title "%s (Figure %i)"'%(info,igfig))
except:
    igfig=0
    gp=Gnuplot.Gnuplot(persist=1)
    gp('set title "%s (Figure %i)"'%(info,igfig))
    gp('set style data lines')
    gp('set xlabel "Step"')
    gp('set ylabel "Variable"')
gp.plot( Gnuplot.Data( v, with_='lines lw 2' ) )
12.5.3.13. Template ValuePrinterSaverAndGnuPlotter
Print on standard output and, in the same, time save in a file available in the system temporary directory and graphically plot with Gnuplot the current value of the variable (persistent plot).
print(str(info)+' '+str(var[-1]))
import os.path, numpy, re, tempfile
tempdir=tempfile.gettempdir()
v=numpy.array(var[-1], ndmin=1)
global istep
try:
    istep+=1
except:
    istep=0
f=os.path.join(tempdir,'value_%s_%05i.txt'%(info,istep))
f=re.sub(r'\s','_',f)
print('Value saved in "%s"'%f)
numpy.savetxt(f,v)
import Gnuplot
global igfig, gp
try:
    igfig+=1
    gp('set title "%s (Figure %i)"'%(info,igfig))
except:
    igfig=0
    gp=Gnuplot.Gnuplot(persist=1)
    gp('set title "%s (Figure %i)"'%(info,igfig))
    gp('set style data lines')
gp.plot( Gnuplot.Data( v, with_='lines lw 2' ) )
12.5.3.14. Template ValueSeriePrinterSaverAndGnuPlotter
Print on standard output and, in the same, time save in a file available in the system temporary directory and graphically plot with Gnuplot the value series of the variable (persistent plot).
print(str(info)+' '+str(var[:]))
import os.path, numpy, re, tempfile
tempdir=tempfile.gettempdir()
v=numpy.array(var[:], ndmin=1)
global istep
try:
    istep+=1
except:
    istep=0
f=os.path.join(tempdir,'value_%s_%05i.txt'%(info,istep))
f=re.sub(r'\s','_',f)
print('Value saved in "%s"'%f)
numpy.savetxt(f,v)
import Gnuplot
global igfig, gp
try:
    igfig+=1
    gp('set title "%s (Figure %i)"'%(info,igfig))
except:
    igfig=0
    gp=Gnuplot.Gnuplot(persist=1)
    gp('set title "%s (Figure %i)"'%(info,igfig))
    gp('set style data lines')
    gp('set xlabel "Step"')
    gp('set ylabel "Variable"')
gp.plot( Gnuplot.Data( v, with_='lines lw 2' ) )
12.5.3.15. Template ValueMatPlotter
Graphically plot with Matplolib the current value of the variable (non persistent plot).
import numpy
import matplotlib.pyplot as plt
v=numpy.array(var[-1], ndmin=1)
global imfig, mp, ax
plt.ion()
try:
    imfig+=1
    mp.suptitle('%s (Figure %i)'%(info,imfig))
except:
    imfig=0
    mp = plt.figure()
    ax = mp.add_subplot(1, 1, 1)
    mp.suptitle('%s (Figure %i)'%(info,imfig))
ax.plot(v)
plt.show()
12.5.3.16. Template ValueMatPlotterSaver
Graphically plot with Matplolib the current value of the variable, and save the figure in a file available in the system temporary directory (persistant plot).
import os.path, numpy, re, tempfile
tempdir=tempfile.gettempdir()
import matplotlib.pyplot as plt
v=numpy.array(var[-1], ndmin=1)
global imfig, mp, ax
plt.ion()
try:
    imfig+=1
    mp.suptitle('%s (Figure %i)'%(info,imfig))
except:
    imfig=0
    mp = plt.figure()
    ax = mp.add_subplot(1, 1, 1)
    mp.suptitle('%s (Figure %i)'%(info,imfig))
ax.plot(v)
f=os.path.join(tempdir,'figure_%s_%05i.pdf'%(info,imfig))
f=re.sub(r'\s','_',f)
plt.savefig(f)
plt.show()
12.5.3.17. Template ValueSerieMatPlotter
Graphically plot with Matplolib the value series of the variable (non persistent plot).
import numpy
import matplotlib.pyplot as plt
v=numpy.array(var[:], ndmin=1)
global imfig, mp, ax
plt.ion()
try:
    imfig+=1
    mp.suptitle('%s (Figure %i)'%(info,imfig))
except:
    imfig=0
    mp = plt.figure()
    ax = mp.add_subplot(1, 1, 1)
    mp.suptitle('%s (Figure %i)'%(info,imfig))
    ax.set_xlabel('Step')
    ax.set_ylabel('Variable')
ax.plot(v)
plt.show()
12.5.3.18. Template ValueSerieMatPlotterSaver
Graphically plot with Matplolib the value series of the variable, and save the figure in a file available in the system temporary directory (persistant plot).
import os.path, numpy, re, tempfile
tempdir=tempfile.gettempdir()
import matplotlib.pyplot as plt
v=numpy.array(var[:], ndmin=1)
global imfig, mp, ax
plt.ion()
try:
    imfig+=1
    mp.suptitle('%s (Figure %i)'%(info,imfig))
except:
    imfig=0
    mp = plt.figure()
    ax = mp.add_subplot(1, 1, 1)
    mp.suptitle('%s (Figure %i)'%(info,imfig))
    ax.set_xlabel('Step')
    ax.set_ylabel('Variable')
ax.plot(v)
f=os.path.join(tempdir,'figure_%s_%05i.pdf'%(info,imfig))
f=re.sub(r'\s','_',f)
plt.savefig(f)
plt.show()
12.5.3.19. Template ValuePrinterAndMatPlotter
Graphically plot with Matplolib the current value of the variable (non persistent plot).
print(str(info)+' '+str(var[-1]))
import numpy
import matplotlib.pyplot as plt
v=numpy.array(var[-1], ndmin=1)
global imfig, mp, ax
plt.ion()
try:
    imfig+=1
    mp.suptitle('%s (Figure %i)'%(info,imfig))
except:
    imfig=0
    mp = plt.figure()
    ax = mp.add_subplot(1, 1, 1)
    mp.suptitle('%s (Figure %i)'%(info,imfig))
ax.plot(v)
plt.show()
12.5.3.20. Template ValuePrinterAndMatPlotterSaver
Graphically plot with Matplolib the current value of the variable, and save the figure in a file available in the system temporary directory (persistant plot).
print(str(info)+' '+str(var[-1]))
import os.path, numpy, re, tempfile
tempdir=tempfile.gettempdir()
import matplotlib.pyplot as plt
v=numpy.array(var[-1], ndmin=1)
global imfig, mp, ax
plt.ion()
try:
    imfig+=1
    mp.suptitle('%s (Figure %i)'%(info,imfig))
except:
    imfig=0
    mp = plt.figure()
    ax = mp.add_subplot(1, 1, 1)
    mp.suptitle('%s (Figure %i)'%(info,imfig))
ax.plot(v)
f=os.path.join(tempdir,'figure_%s_%05i.pdf'%(info,imfig))
f=re.sub(r'\s','_',f)
plt.savefig(f)
plt.show()
12.5.3.21. Template ValueSeriePrinterAndMatPlotter
Graphically plot with Matplolib the value series of the variable (non persistent plot).
print(str(info)+' '+str(var[:]))
import numpy
import matplotlib.pyplot as plt
v=numpy.array(var[:], ndmin=1)
global imfig, mp, ax
plt.ion()
try:
    imfig+=1
    mp.suptitle('%s (Figure %i)'%(info,imfig))
except:
    imfig=0
    mp = plt.figure()
    ax = mp.add_subplot(1, 1, 1)
    mp.suptitle('%s (Figure %i)'%(info,imfig))
    ax.set_xlabel('Step')
    ax.set_ylabel('Variable')
ax.plot(v)
plt.show()
12.5.3.22. Template ValueSeriePrinterAndMatPlotterSaver
Graphically plot with Matplolib the value series of the variable, and save the figure in a file available in the system temporary directory (persistant plot).
print(str(info)+' '+str(var[:]))
import os.path, numpy, re, tempfile
tempdir=tempfile.gettempdir()
import matplotlib.pyplot as plt
v=numpy.array(var[:], ndmin=1)
global imfig, mp, ax
plt.ion()
try:
    imfig+=1
    mp.suptitle('%s (Figure %i)'%(info,imfig))
except:
    imfig=0
    mp = plt.figure()
    ax = mp.add_subplot(1, 1, 1)
    mp.suptitle('%s (Figure %i)'%(info,imfig))
    ax.set_xlabel('Step')
    ax.set_ylabel('Variable')
ax.plot(v)
f=os.path.join(tempdir,'figure_%s_%05i.pdf'%(info,imfig))
f=re.sub(r'\s','_',f)
plt.savefig(f)
plt.show()
12.5.3.23. Template ValuePrinterSaverAndMatPlotter
Print on standard output and, in the same, time save in a file available in the system temporary directory and graphically plot with Matplolib the current value of the variable (non persistent plot).
print(str(info)+' '+str(var[-1]))
import os.path, numpy, re, tempfile
tempdir=tempfile.gettempdir()
import matplotlib.pyplot as plt
v=numpy.array(var[-1], ndmin=1)
global istep
try:
    istep+=1
except:
    istep=0
f=os.path.join(tempdir,'value_%s_%05i.txt'%(info,istep))
f=re.sub(r'\s','_',f)
print('Value saved in "%s"'%f)
numpy.savetxt(f,v)
global imfig, mp, ax
plt.ion()
try:
    imfig+=1
    mp.suptitle('%s (Figure %i)'%(info,imfig))
except:
    imfig=0
    mp = plt.figure()
    ax = mp.add_subplot(1, 1, 1)
    mp.suptitle('%s (Figure %i)'%(info,imfig))
ax.plot(v)
plt.show()
12.5.3.24. Template ValuePrinterSaverAndMatPlotterSaver
Print on standard output and, in the same, time save in a file available in the system temporary directory and graphically plot with Matplolib the current value of the variable (saved and non persistent plot).
print(str(info)+' '+str(var[-1]))
import os.path, numpy, re, tempfile
tempdir=tempfile.gettempdir()
import matplotlib.pyplot as plt
v=numpy.array(var[-1], ndmin=1)
global istep
try:
    istep+=1
except:
    istep=0
f=os.path.join(tempdir,'value_%s_%05i.txt'%(info,istep))
f=re.sub(r'\s','_',f)
print('Value saved in "%s"'%f)
numpy.savetxt(f,v)
global imfig, mp, ax
plt.ion()
try:
    imfig+=1
    mp.suptitle('%s (Figure %i)'%(info,imfig))
except:
    imfig=0
    mp = plt.figure()
    ax = mp.add_subplot(1, 1, 1)
    mp.suptitle('%s (Figure %i)'%(info,imfig))
ax.plot(v)
f=os.path.join(tempdir,'figure_%s_%05i.pdf'%(info,imfig))
f=re.sub(r'\s','_',f)
plt.savefig(f)
plt.show()
12.5.3.25. Template ValueSeriePrinterSaverAndMatPlotter
Graphically plot with Matplolib the value series of the variable (non persistent plot).
print(str(info)+' '+str(var[:]))
import os.path, numpy, re, tempfile
tempdir=tempfile.gettempdir()
import matplotlib.pyplot as plt
v=numpy.array(var[:], ndmin=1)
global istep
try:
    istep+=1
except:
    istep=0
f=os.path.join(tempdir,'value_%s_%05i.txt'%(info,istep))
f=re.sub(r'\s','_',f)
print('Value saved in "%s"'%f)
numpy.savetxt(f,v)
global imfig, mp, ax
plt.ion()
try:
    imfig+=1
    mp.suptitle('%s (Figure %i)'%(info,imfig))
except:
    imfig=0
    mp = plt.figure()
    ax = mp.add_subplot(1, 1, 1)
    mp.suptitle('%s (Figure %i)'%(info,imfig))
    ax.set_xlabel('Step')
    ax.set_ylabel('Variable')
ax.plot(v)
plt.show()
12.5.3.26. Template ValueSeriePrinterSaverAndMatPlotterSaver
Graphically plot with Matplolib the value series of the variable, and save the figure in a file available in the system temporary directory (saved and persistant plot).
print(str(info)+' '+str(var[:]))
import os.path, numpy, re, tempfile
tempdir=tempfile.gettempdir()
import matplotlib.pyplot as plt
v=numpy.array(var[:], ndmin=1)
global istep
try:
    istep+=1
except:
    istep=0
f=os.path.join(tempdir,'value_%s_%05i.txt'%(info,istep))
f=re.sub(r'\s','_',f)
print('Value saved in "%s"'%f)
numpy.savetxt(f,v)
global imfig, mp, ax
plt.ion()
try:
    imfig+=1
    mp.suptitle('%s (Figure %i)'%(info,imfig))
except:
    imfig=0
    mp = plt.figure()
    ax = mp.add_subplot(1, 1, 1)
    mp.suptitle('%s (Figure %i)'%(info,imfig))
    ax.set_xlabel('Step')
    ax.set_ylabel('Variable')
ax.plot(v)
f=os.path.join(tempdir,'figure_%s_%05i.pdf'%(info,imfig))
f=re.sub(r'\s','_',f)
plt.savefig(f)
plt.show()
12.5.3.27. Template ValueMean
Print on standard output the mean of the current value of the variable.
import numpy
print(str(info)+' '+str(numpy.nanmean(var[-1])))
12.5.3.28. Template ValueStandardError
Print on standard output the standard error of the current value of the variable.
import numpy
print(str(info)+' '+str(numpy.nanstd(var[-1])))
12.5.3.29. Template ValueVariance
Print on standard output the variance of the current value of the variable.
import numpy
print(str(info)+' '+str(numpy.nanvar(var[-1])))
12.5.3.30. Template ValueL2Norm
Print on standard output the L2 norm of the current value of the variable.
import numpy
v = numpy.ravel( var[-1] )
print(str(info)+' '+str(float( numpy.linalg.norm(v) )))
12.5.3.31. Template ValueRMS
Print on standard output the root mean square (RMS), or quadratic mean, of the current value of the variable.
import numpy
v = numpy.ravel( var[-1] )
print(str(info)+' '+str(float( numpy.sqrt((1./v.size)*numpy.dot(v,v)) )))