Contour presentation
Contour presentation combines all equal scalar values applied to the cells and constructs isobaric surfaces.
To create a Contour presentation,
Select a field item in the Object Browser, and
Choose Presentations > Contour menu or click
 button in the Presentations toolbar.
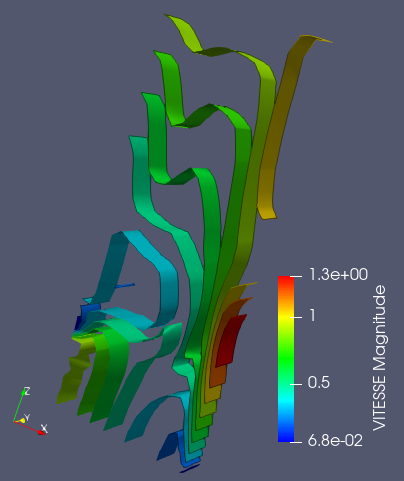
As a result, Contour presentation is published in the Object Browser under selected field and displayed in the 3D Viewer.
Contour presentation has the same base parameters as Scalar map presentation, plus the following own ones:
Number of contours: number of contours which are generated: max allowed value of this parameter is 50,
Contour By: this parameter is available only for vector fields; it allows choosing the component of the vector field from which isobaric surfaces are generated.